Now that we’ve covered option basics, and before we get into modeling, we’ll cover trading, which consists of timing and structuring. That’s it, only two things. This isn’t all that complicated. Remember, sell high and buy back (or expire) low. That’s the game, the rest is details. With respect to timing, the questions are: when is it optimal to sell an option – what triggers the trade, and when is it optimal to buy back the option (and the underlying if a call) rather than letting it run to expiration. To initiate the trade, this model and my actual trading use the MACD as an indicator of change in stock price direction. The model additionally supplements MACD with a price change requirement. The idea here is that bigger price drops provide additional motive force upward, rather like a coiled spring, once the bottom occurs. And vice versa. Buy back is currently triggered solely by the achievement of a hurdle rate, though future research will explore using the MACD to supplement this decision (as I currently do in trading to exit trades early). With respect to structuring, the questions are: what is the optimal strike and what is the optimal term-to-expiration.
So, adding all this up, there are three MACD parameters, two parameters to handle percent price drop over a given look back period, one parameter for the buy back hurdle, and two for structuring (moneyness and TTE). Puts and calls are optimized separately, so that’s a total of 16 governing parameters. The model (the code) searches for the value of each of these parameters, that in combination with the other parameters, gives the ‘best result’. ‘Best result’, the optimal, is defined as the highest ending portfolio market value. In a world where underwater stock from put options expiring in the money and call options expiring worthless are immediately economically reconciled, this is the same as maximizing realized gain. Currently, the optimization is done over the 40 stocks in the stable and over the entire 16.5-year trading (backtest) period, using a brute force method. Brute force just means every possible combination of each parameter, within a specified range and at specified intervals for each, is evaluated. In a future iteration of the model, I’ll explore regime-based optimization and perhaps there are ways to group stocks (growth vs. value?) to allow a meaningful differential optimization of the governing parameters over time and across the stable of stocks. There’s always a danger of overfitting an optimization, but so far I’m confident I’m nowhere close to doing this, nor would I be with the above mentioned enhancements.
The model currently does not use implied volatility as a trigger. This is not to say that implied volatility or IV percentile may not be very helpful indicators, and they are popular amongst option traders. It’s merely that the model does not have this information available to it. It relies solely on the prices of the underlying, and uses historical volatility as an input to Black Scholes Merton to calculate option prices. In my research, I’ve observed that implied and historical volatility do a mean reversion dance with one another over time, sometimes one being higher than the other, then flipping their relationship. So for a long term backtest, the current approach should be fine. In a future version of the model, I intend to import option prices and use these to determine trades, as I do in actual trading. This increased accuracy will be necessary to using the model to inform the trade decision in real time.
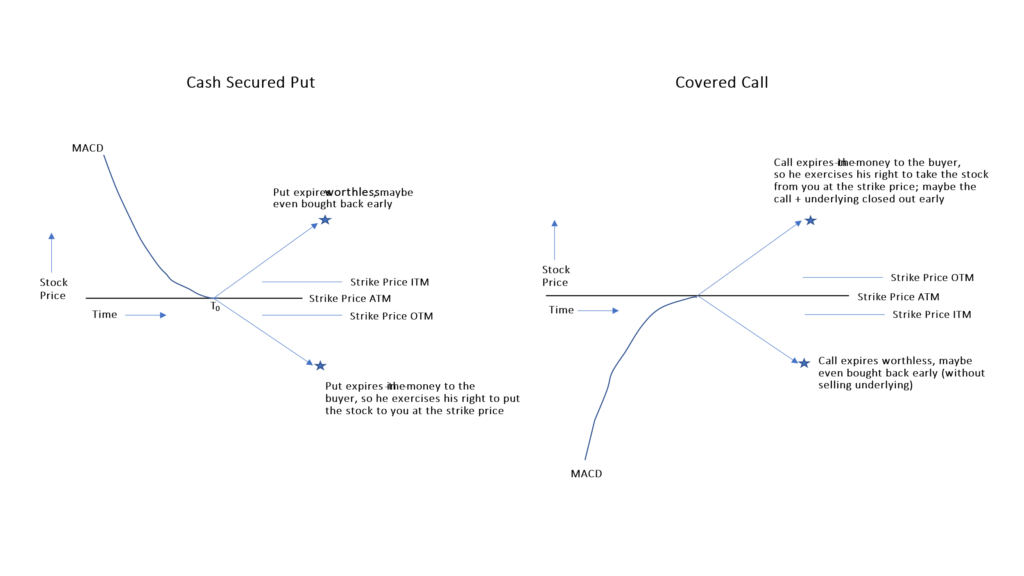
So, when is it the best time to sell options? Once again, puts are straightforward: you want to sell them as the MACD on the underlying is bottoming, as the price movement has finished its approach to the strike and a trend reversal seems imminent. This is when FUD (fear, uncertainty, distrust) is maximized for that price cycle. Calls are a little trickier. The current version of the model finds the optimal outcomes to occur when calls are sold as the MACD on the underlying is peaking and the price movement has finished its approach to the strike and a trend reversal seems imminent. This is when FOMO (fear of missing out) is maximized. As we discussed in the prior section, the model has demonstrated that it’s better to not buy back the call option only, leaving dead money. Rather, the best results occur when only pair buybacks (call option plus the underlying) are allowed – and of course, expiration outcomes if the buyback hurdle isn’t achieved. I experimented with selling calls when the price movement of the underlying was on the upswing. The thought here was that I might be able to reduce the incidence of/magnitude of underwater underlyings resulting from worthless expired calls. This timing approach was nowhere near optimal, no matter how I structured the trade or specified the timing (MACD parameters). In the next version of the model, using real option prices, I’ll try this approach again because it would seem to have some potential.
After all is said and done, the game is this: you are waiting for the market to come to you. You are lying in wait for the right set up. This is rather like antelope hunting in WY: you have to wait for them to come to you. You can’t chase them. You’re waiting for the premium to maximize, which is the same as maximizing your prospective return. If you can catch it just as the trading trend is reversing, for a call when the FOMO or a put when the FUD is at a fever pitch, you’ll get the premium at the high for that cycle. If it’s over your prospective return hurdle (more on this later), do the deal. It’s a beautiful thing. And it happens all the time. Below is a stylized pic to help you visualize what’s going on.

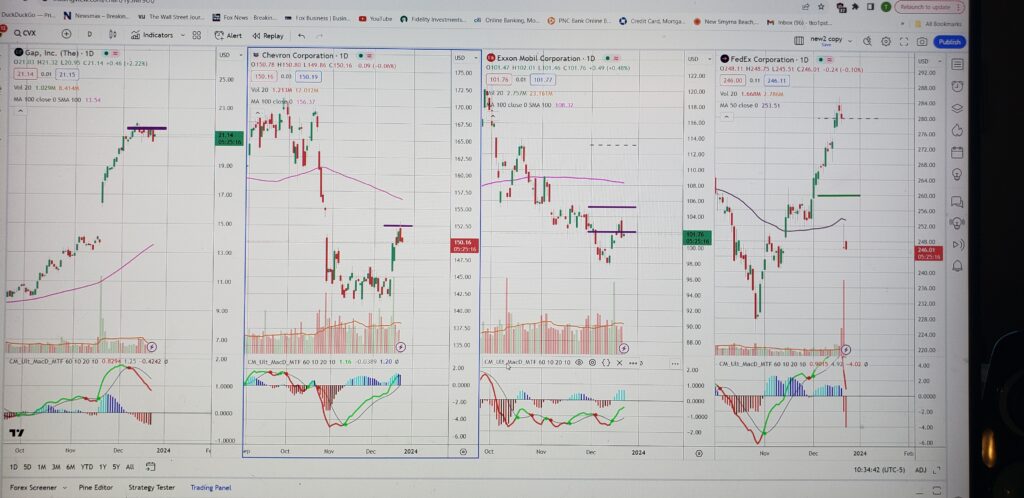
Just below, I show a screen shot (courtesy of Trading View) of actual trades done during late November / December: for GPS, CVX, XOM, and FDX. Each has an expiration date of December 29; I wanted these all resolved in the current year. You can see for the first three, a solid purple line near the local top of the price cycle. Each of these trades is structured so the strike price is at or above the purchase cost. I’m hoping they’re called, so that I can start the year with fresh money. A dashed purple line indicates the purchase cost where I have available shares and therefore about where call options should be struck. These dashed purple lines represent dead money. FDX has a put in place, shown by the solid green line, after a classic set up occurred: for whatever reason, the price fell off the cliff and a hugely profitable (prospectively) put sale opportunity presented itself. Merry Christmas!

xxx
I close this section on trading with a few practical considerations. First, as I mentioned earlier, one option contract is for 100 shares of the underlying. That’s just the way things are (apologies to the movie “Babe”). For puts and calls. You can’t trade less than 1 option contract. So, if the price of the particular underlying is high enough, you may not have the cash to sell secured puts and calls on that underlying. Second, I use limit orders whenever I trade options, whether there’s a tight bid-ask spread or not. I don’t trust the sharks inhabiting this neighborhood. I tend not to trade options with a wide bid-ask spread. If I do trade a relatively illiquid option, I will toss out an ask (when selling an option) that seems unlikely to be hit, just to mess with them. Sometimes, lo and behold, it gets hit. If it’s not hit, I walk it in towards the mid-point. And vice versa when buying them back.
Third, strike levels and terms to expiration vary in their spacing (their density, if you will) depending on the liquidity of the options on a particular underlying. Sometimes the spacing of the strikes, and the price point where the MACD changes direction, is such that you are too far from an available strike for the prospective return to be adequate. As an example: let’s say you’d be happy with a strike of $113 for selling a call (let’s say your purchase cost is $112), but the only available strikes are at 110 and 120. At 110, you’d have a loss if the underlying is called. At a strike of 120, you’d have a gain, but the stock starts topping at 114, too soon for a profitable call sold at a strike of 120. There’s not much to be done here, other than to wait for a better up cycle, or sell the stock (at a small gain) and find another option opportunity. This doesn’t happen too often with the stocks in the my stable, because they’re super liquid. Most of the ones that it did happen to have been weeded out of the portfolio. Similarly, the term to expiration schedule can sometimes have gaps, so you may have to sell an option with a longer or shorter than desired term. This isn’t the end of the world; it’s just not optimal. Again, this doesn’t happen all that often.
Next in sequence: Modeling Option Trading
Back to Home